In 2017, we won the competition for the development of the transaction core for Alfa-Bank's investment business and started working at once. (Vladimir Drynkin, Development Team Lead for Alfa-Bank's Investment Business Transaction Core, spoke about the investment business core at HighLoad++ 2018.) This system was supposed to aggregate transaction data in different formats from various sources, unify the data, save it, and provide access to it.
In the process of development, the system evolved and extended its functions. At some point, we realized that we created something much more than just application software designed for a well-defined scope of tasks: we created a system for building distributed applications with persistent storage. Our experience served as a basis for the new product, Tarantool Data Grid (TDG).
I want to talk about TDG architecture and the solutions that we worked out during the development. I will introduce the basic functions and show how our product could become the basis for building turnkey solutions.
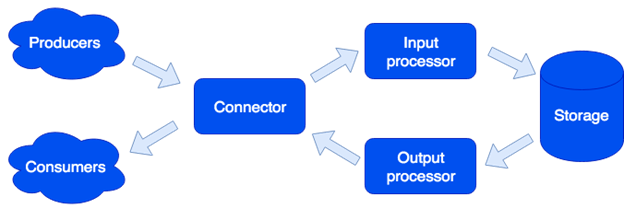
In terms of architecture, we divided the system into separate roles. Every one of them is responsible for a specific range of tasks. One running instance of an application implements one or more role types. There may be several roles of the same type in a cluster:

Connector
The Connector is responsible for communication with the outside world; it is designed to accept the request, parse it, and if it succeeds, then it sends the data for processing to the input processor. The following formats are supported: HTTP, SOAP, Kafka, FIX. The architecture allows us to add support for new formats (IBM MQ support is coming soon). If request parsing fails, the connector returns an error. Otherwise, it responds that the request has been processed successfully, even if an error occurred during further processing. This is done on purpose in order to work with the systems that do not know how to repeat requests, or vice versa, do it too aggressively. To make sure that no data is lost, the repair queue is used: the object joins the queue and is removed from it only after successful processing. The administrator receives notifications about the objects remaining in the repair queue and can retry processing after handling a software error or hardware failure.
Input Processor
The Input Processor categorizes the received data by characteristics and calls the corresponding handlers. Handlers are Lua code that runs in a sandbox, so they cannot affect the system operation. At this stage, the data could be transformed as required, and if necessary, any number of tasks may run to implement the necessary logic. For example, when adding a new user in MDM (Master Data Management built based on Tarantool Data Grid), a golden record would be created as a separate task so that the request processing doesn't slow down. The sandbox supports requests for reading, changing, and adding data. It also allows you to call some function for all the roles of the storage type and aggregate the result (map/reduce).
Handlers can be described in files:
sum.lua

local x, y = unpack(...)
return x + y
Then declared in the configuration:
functions:
  sum: { __file: sum.lua }
Why Lua? Lua is a straightforward language. Based on our experience, people start to write code that would solve their problem only a couple of hours after seeing the language for the first time. And these are not only professional developers, but for example, analysts. Moreover, thanks to the JIT compiler, Lua is sppedy.
Storage
The Storage stores persistent data. Before saving, the data is validated for compliance with the data scheme. To describe the scheme, we use the extended Apache Avro format. Example:
{
    "name": "User",
    "type": "record",
    "logicalType": "Aggregate",
    "fields": [
        { "name": "id", "type": "string" },
        { "name": "first_name", "type": "string" },
        { "name": "last_name", "type": "string" }
    ],
    "indexes": ["id"]
}
Based on this description, DDL (Data Definition Language) for Tarantool DBMS and GraphQL schema for data access are generated automatically.
Asynchronous data replication is supported (we also plan to add synchronous replication).
Output Processor
Sometimes it is necessary to notify external consumers about the new data. That is why we have the Output Processor role. After saving the data, it could be transferred into the appropriate handler (for example, to transform it as required by the consumer), and then transferred to the connector for sending. The repair queue is also used here: if no one accepts the object, the administrator can try again later.
Scaling
The Connector, Input Processor, and Output Processor roles are stateless, which allows us to scale the system horizontally by merely adding new application instances with the necessary enabled role. For horizontal storage scaling, a cluster is organized using the virtual buckets approach. After adding a new server, some buckets from the old servers move to a new server in the background. This process is transparent for the users and does not affect the operation of the entire system.
Data Properties
Objects may be huge and contain other objects. We ensure adding and updating data atomically, and saving the object with all the dependencies on a single virtual bucket. This is done to avoid the so-called «smearing» of the object across multiple physical servers.
Versioning is also supported: each update of the object creates a new version, and we can always make a time slice to see how everything looked like at the time. For data that does not need a long history, we can limit the number of versions or even store only the last one, that is, we can disable versioning for a specific data type. We can also set the historical limits: for example, delete all the objects of a specific type older than a year. Archiving is also supported: we can upload objects above a certain age to free up the cluster space.
Tasks
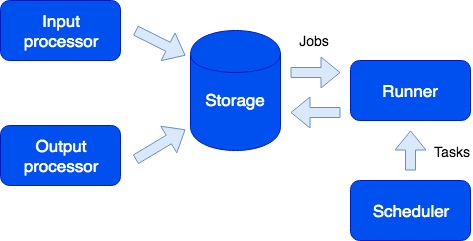
Interesting features to be noted include the ability to run tasks on time, at the user's request, or automatically from the sandbox:

Here we can see another role called Runner. This role has no state; if necessary, more application instances with this role could be added to the cluster. The Runner is responsible for completing the tasks. As I have already mentioned, new tasks could be created from the sandbox; they join the queue on the storage and then run on the runner. This type of tasks is called a Job. We also have a task type called Task, that is, a user-defined task that would run on time (using the cron syntax) or on-demand. To run and track such tasks, we have a convenient task manager. The scheduler role must be enabled to use this function. This role has a state, so it does not scale which is not necessary anyway. However, like any other role it can have a replica that starts working if the master suddenly fails.
Logger
Another role is called Logger. It collects logs from all cluster members and provides an interface for uploading and viewing them via the web interface.
Services
It is worth mentioning that the system makes it easy to create services. In the configuration file, you can specify which requests should be sent to the user-written handler running in the sandbox. Such a handler may, for example, perform some kind of analytical request and return the result.
The service is described in the configuration file:
services:
   sum:
      doc: "adds two numbers"
      function: sum
      return_type: int
      args:
             x: int
             y: int
The GraphQL API is generated automatically, and the service is available for calls:
query {
   sum(x: 1, y: 2)
}
This calls the
sum handler that returns the result:
3Request Profiling and Metrics
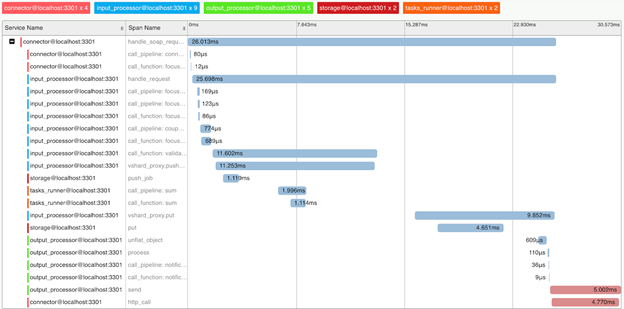
We implemented support for the OpenTracing protocol to bring a better understanding of the system mechanisms and request profiling. On demand, the system can send information about how the request was executed to tools supporting this protocol (e.g. Zipkin):

Needless to say, the system provides internal metrics that can be collected using Prometheus and visualized using Grafana.
Deployment
Tarantool Data Grid can be deployed from RPM-packages or archives using the built-in utility or Ansible. Kubernetes is also supported (Tarantool Kubernetes Operator).
An application that implements business logic (configuration, handlers) is loaded into the deployed Tarantool Data Grid cluster in the archive via the UI or as a script using the provided API.
Sample Applications
What applications can you create with Tarantool Data Grid? In fact, most business tasks are somehow related to data stream processing, storing and accessing. Therefore, if you have large data streams that require secure storage, and accessibility, then our product could save you much time in development and help you concentrate on your business logic.
For example, you would like to gather information about the real estate market to stay up to date on the best offers in the future. In this case, we single out the following tasks:
- Robots gathering information from open sources would be your data sources. You can solve this problem using ready-made solutions or by writing code in any language.
- Next, Tarantool Data Grid accepts and saves the data. If the data format from various sources is different, then you could write code in Lua that would convert everything to a single format. At the pre-processing stage, you could also, for example, filter recurring offers or further update database information about agents operating in the market.
- Now you already have a scalable solution in the cluster that could be filled with data and used to create data samples. Then you can implement new functions, for example, write a service that would create a data request and return the most advantageous offer per day. It would only require several lines in the configuration file and some Lua code.
What is next?
For us, a priority is to increase the development convenience with Tarantool Data Grid. (For example, this is an IDE with support for profiling and debugging handlers that work in the sandbox.)
We also pay great attention to security issues. Right now, our product is being certified by FSTEC of Russia (Federal Service for Technology and Export Control) to acknowledge the high level of security and meet the certification requirements for software products used in personal data information systems and federal information systems.
Комментариев нет:
Отправить комментарий